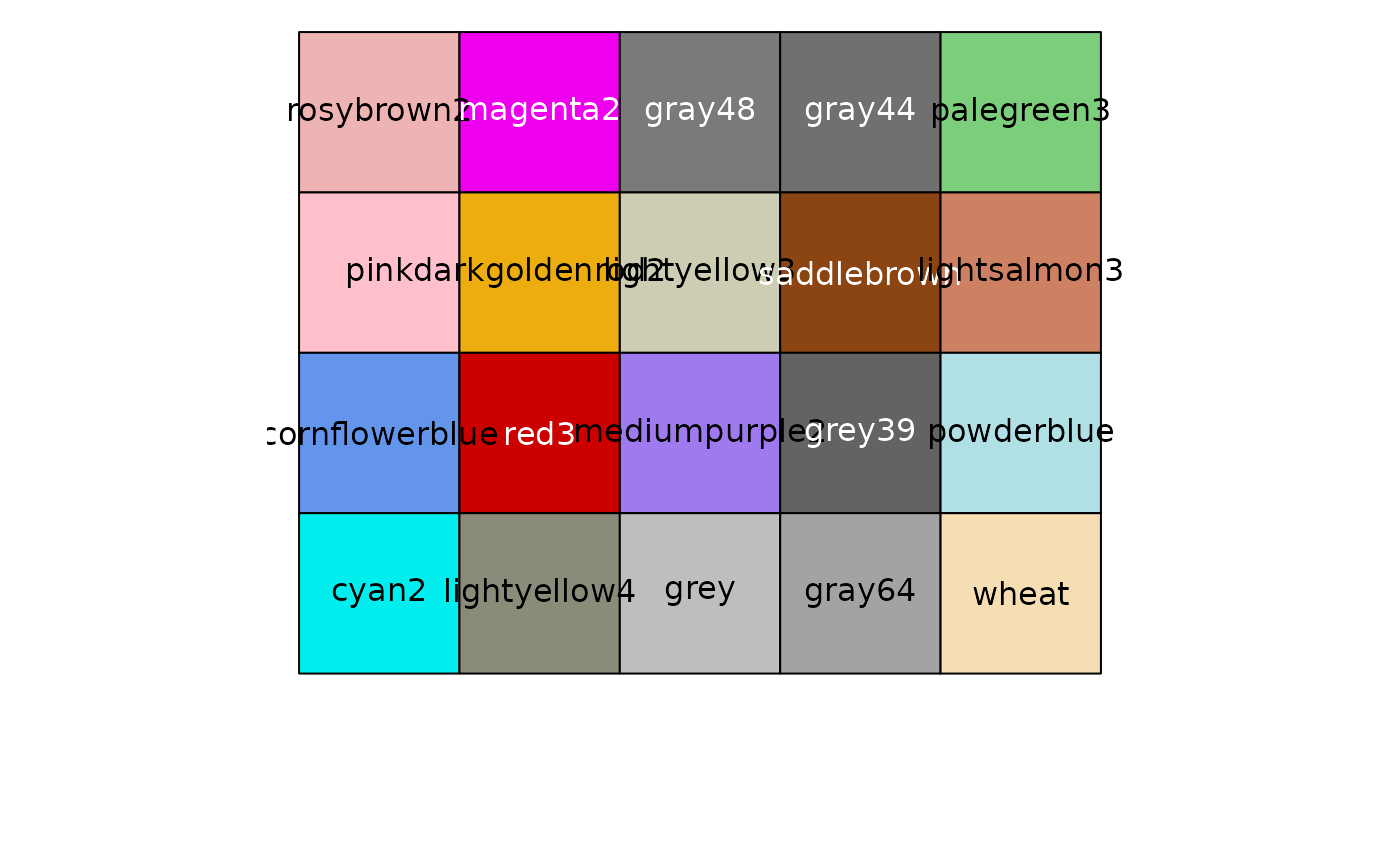
Plots color examples with contrasting text. Parameters are passed to contrast_text.
Arguments
- colors
Vector of colors to plot
- labels
Show color names. Default is TRUE
- borders
Border parameter for 'rect()' function. Default is NULL
- cex_label
Label size. Default is 1.
- ncol
Desired number of columns. Default is ceiling of square root to the length of 'colors' vector provided.
- ...
Passed to the 'contrast_text()'
