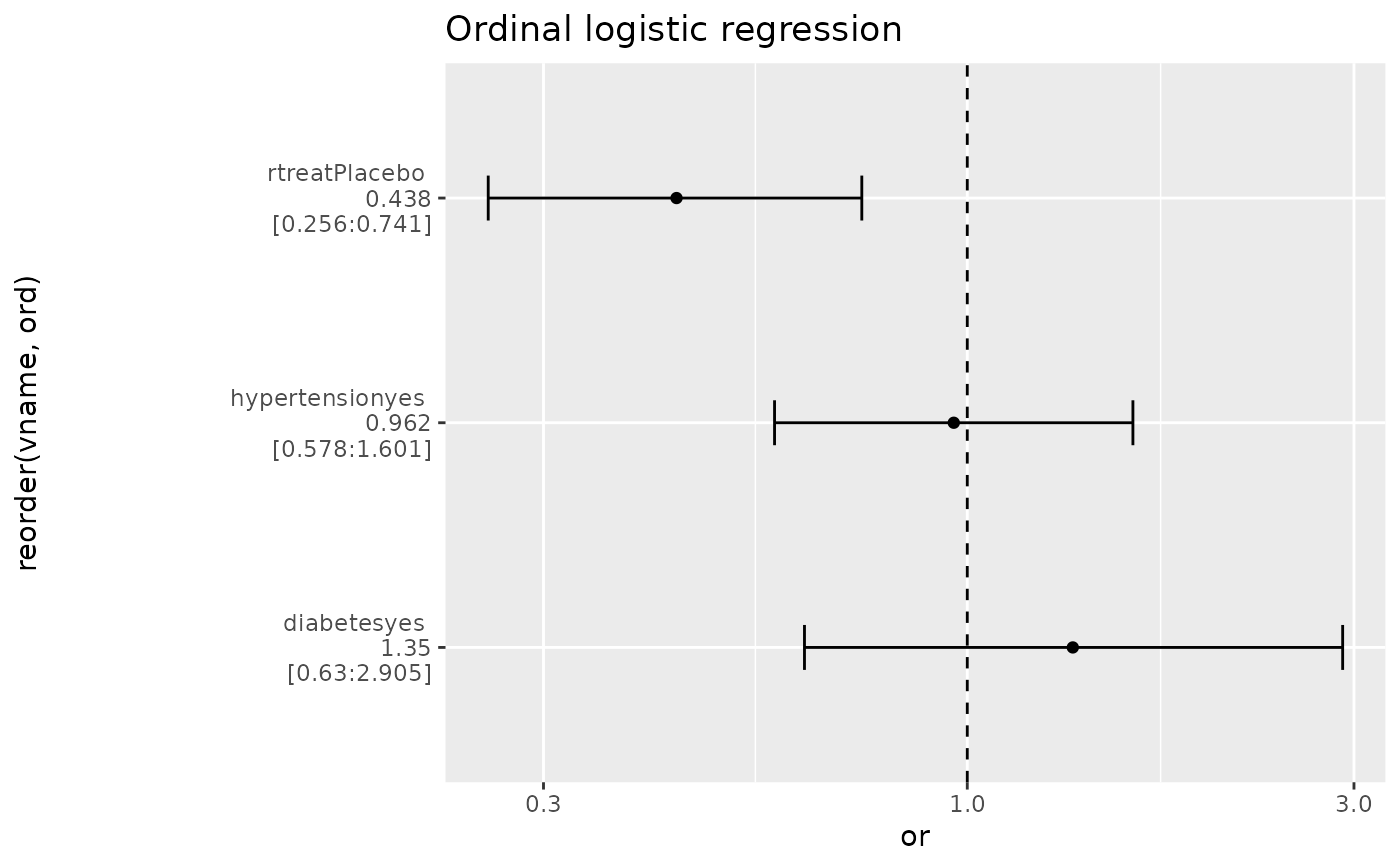
Horizontal forest plot of point estimate with confidence intervals. Includes dichotomous or olr, depending on number of levels in "x". Title and axis labels can be added to the ggplot afterwards.
Usage
ci_plot(
  ds,
  x = NULL,
  y = NULL,
  vars = NULL,
  dec = 3,
  lbls = NULL,
  title = NULL,
  method = "auto"
)
Arguments
- ds
main input, either data set or logistic model
- x
text string of main exposure variable
- y
text string of outcome variable
- vars
variables for multivariate analysis.
- dec
Decimals in labels
- lbls
Labels for variable names
- title
Plot title. Can be specified later.
- method
Character vector. The method for the regression. Can be c("auto", "model").
Examples
# Auto plot
data(talos)
talos[,"mrs_1"]<-factor(talos[,"mrs_1"],ordered=TRUE)
ci_plot(ds = talos, x = "rtreat", y = "mrs_1",
vars = c("hypertension","diabetes"))
#> Waiting for profiling to be done...

## Model plot
# iris$ord<-factor(sample(1:3,size=nrow(iris),replace=TRUE),ordered=TRUE)
# lm <- MASS::polr(ord~., data=iris, Hess=TRUE, method="logistic")
# ci_plot(ds = lm, method="model")
## Model plot
# iris$ord<-factor(sample(1:3,size=nrow(iris),replace=TRUE),ordered=TRUE)
# lm <- MASS::polr(ord~., data=iris, Hess=TRUE, method="logistic")
# ci_plot(ds = lm, method="model")