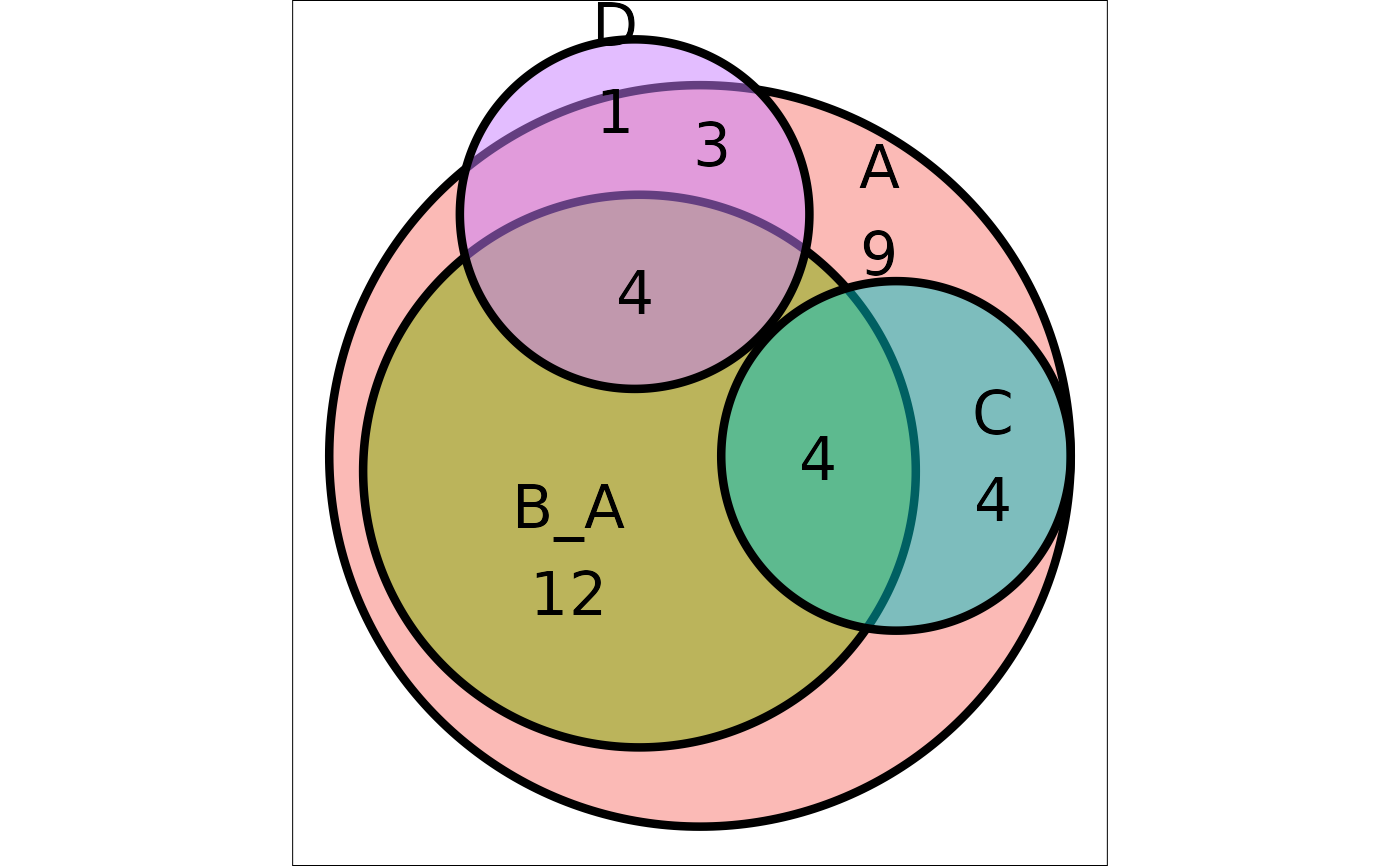
data.frame(
  A = sample(c(TRUE, TRUE, FALSE), 50, TRUE),
  B = sample(c("A", "C"), 50, TRUE),
  C = sample(c(TRUE, FALSE, FALSE, FALSE), 50, TRUE),
  D = sample(c(TRUE, FALSE, FALSE, FALSE), 50, TRUE)
) |> plot_euler_single()

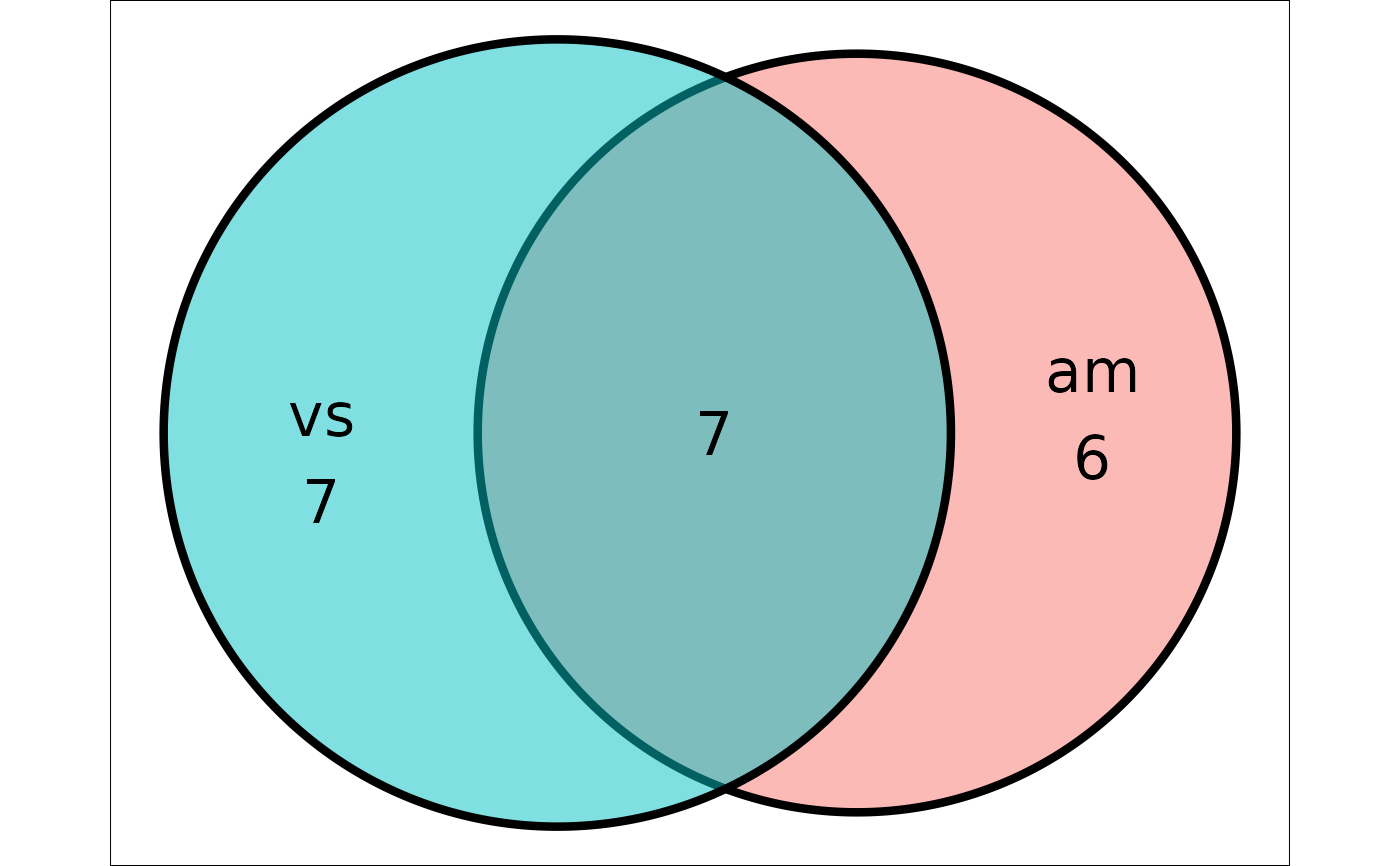
mtcars[c("vs", "am")] |> plot_euler_single()
